Using the View Visualizer
This is an excerpt from an internal email at EPS/CODE, explaining improved features of the View-Visualizer tool:
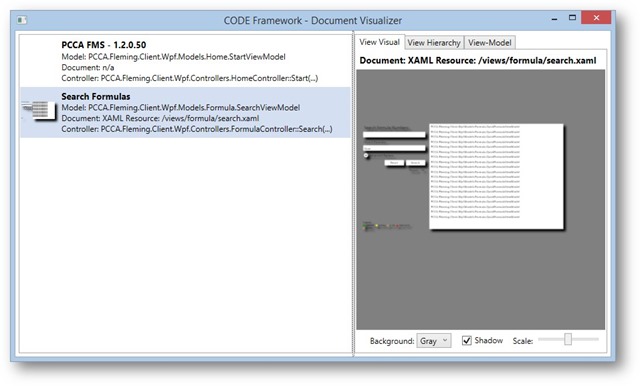
The main screen of the visualizer had some cosmetic improvements:
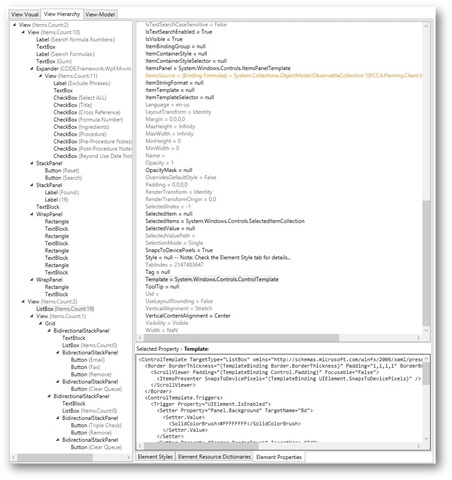
More importantly, the View Hierarchy display has been improved. Here’s the display that shows the styles for a selected textbox:
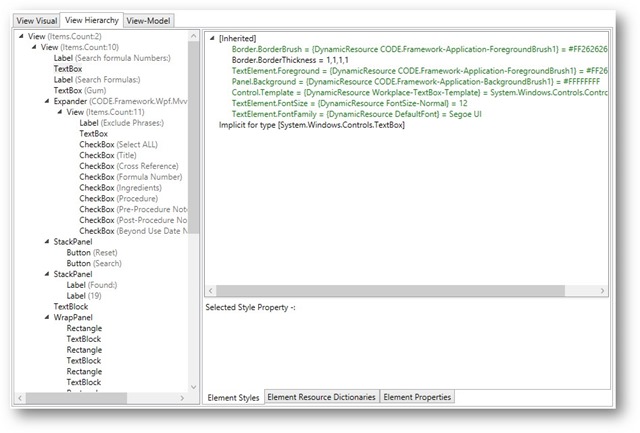
This shows a bit more detail. For instance, each property is not just listed as the property but also the class it goes with (such as “TextElement.FontSize” rather than just “FontSize”). Each styled property now shows not just the value or whether it is bound to a style, but styles are now color coded in green (just like in Blend/VS) when the styles properties themselves are pointed to another resource. Also, when that is the case, the value that is currently brought in by that resource is now also shown. Furthermore, when you pick one of those style properties, more information is now shown in a meaningful way. For instance, when you pick the FontFamily property, you see this:
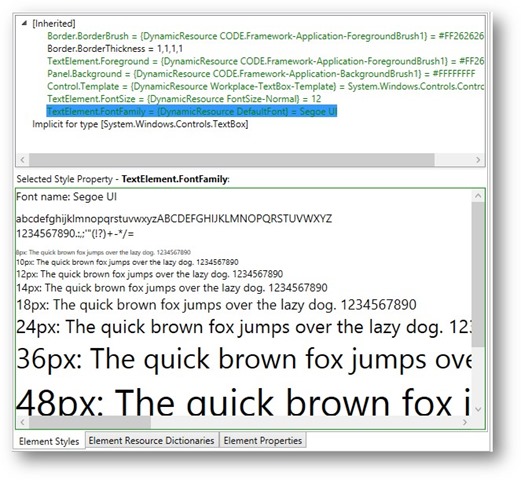
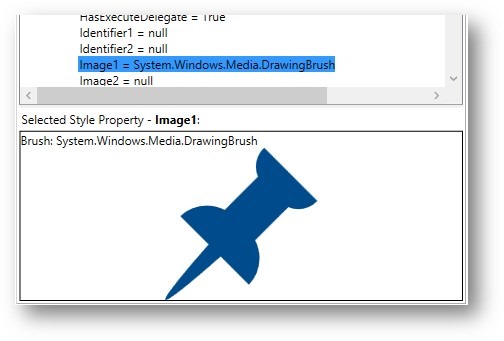
Different elements show different detail. Some just show the actual value in a larger text area. Others, like the FontFamily element above, show custom settings. Another example is the display of brushes like this one:
One of the features that is most useful to me is that properties that themselved represent UI Elements (WPF objects) of some sort, are serialized back to XAML and displayed as such. For instance, when you pick a template of some sort, you will see something like this:
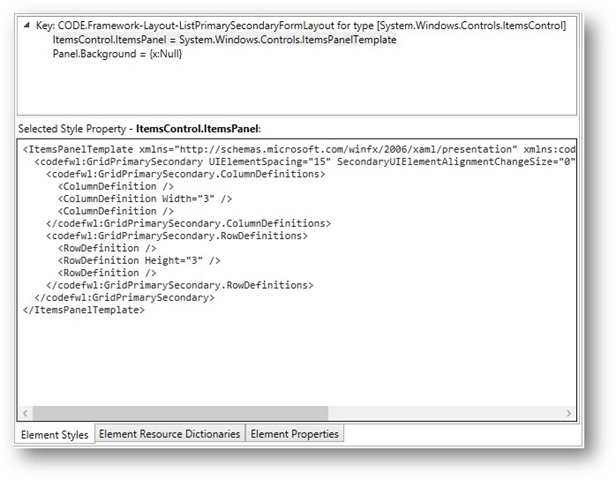
I think that feature in particular was one of the most useful ones in my recent work on some performance improvement projects.
In addition to showing styles and resources that apply to a control in the visual tree, the visualizer now shows a complete list of all (dependency) properties that go with the control, including color coding for data binding (yellow) and resources/styles (green). And also, even for data bound properties, it shows the actual binding expression in detail, as well as the current value. Plus, you can select each property and see more detail (just like in the styles above):
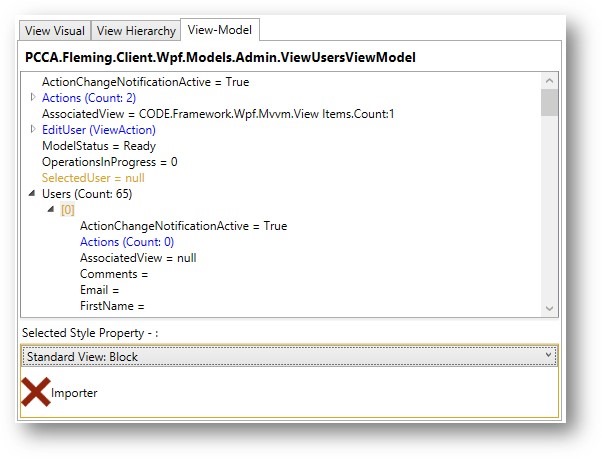
Finally, there now is a completely new tab for the view-model:
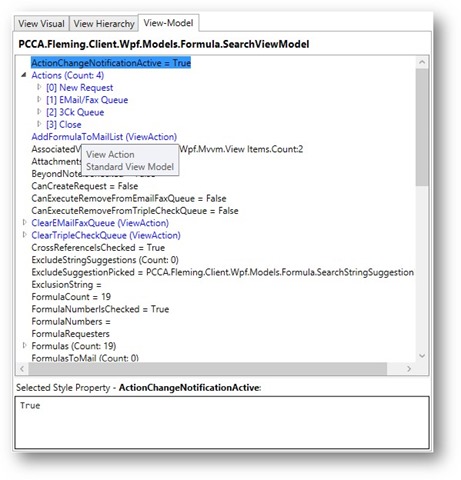
So this shows the view model properties in a way that makes it a bit more easy to see what is going on that to just look at the debugger window. It shows all properties and collections. It highlights things like collection item count. It highlights View-Actions (blue) as well as all members that are based on standard view models (gold). (You can also mouse over to see a tooltip for items that are multiples of those).
One of the nifty little details here is that if you select a member that is based on a standard view model, the detail visualizes the item using a standard view template, and you get to pick other templates if you wanted to see what it would look like if that element was visualized with one of the default templates supported by the current theme: